
The ABCs of Crypto
web3 infrastructure
Nakamoto Coefficient: Measuring Validator Decentralization
The Nakamoto coefficient is the smallest number of independent entities that would have to collude to halt or censor a network.
SEP 22, 2026
Last updated SEP 22, 2026 · V1
TL;DR
- The Nakamoto coefficient is the smallest number of independent entities that would have to collude to halt or censor a network, found by ranking participants by stake and counting how many reach the 33% threshold.
- Validator count says little about decentralization, because the superminority, the set of validators holding more than 33% of stake, can be a small fraction of a large validator list.
- Real decentralization spans four axes: stake distribution, client diversity, hosting and cloud concentration, and jurisdictional spread.
- On a September 22, 2026 snapshot the coefficients bear little relation to headcount: Ethereum reads 1–5, Solana 18, and Aptos 14 on roughly 85 validators, while Canton uses equal-vote BFT among 55 institutions.
- Delegators change the number with every allocation, and choosing independent operators outside the superminority raises it.
- Everstake has historically operated validators on 130+ networks as an independent operator with a multi-geo, multi-provider footprint, one of the inputs to a network’s coefficient.
What the Nakamoto coefficient measures
The Nakamoto coefficient counts the minimum number of independent participants needed to control a critical subsystem of a blockchain. The metric was proposed in 2017 by Balaji Srinivasan and Leland Lee.
A higher number means more parties must cooperate to break the network. The formula is: rank every participant by the resource that grants control, add their shares from the largest down, and count how many you need to cross the attack threshold.
For proof-of-stake networks, the threshold is 33% of stake, the point at which a colluding group can stop the chain from finalizing new blocks. For proof-of-work networks, the threshold is 51% of hash power.
The concept applies to every subsystem. Client software, hosting providers, developers and governance each have their own coefficient.
How the Nakamoto coefficient is calculated
Consider a simplified network with 10 validators and the illustrative stake distribution below, built to show the arithmetic.To find the consensus coefficient, rank validators from the highest stake down. Add each share until the running total crosses 33%.
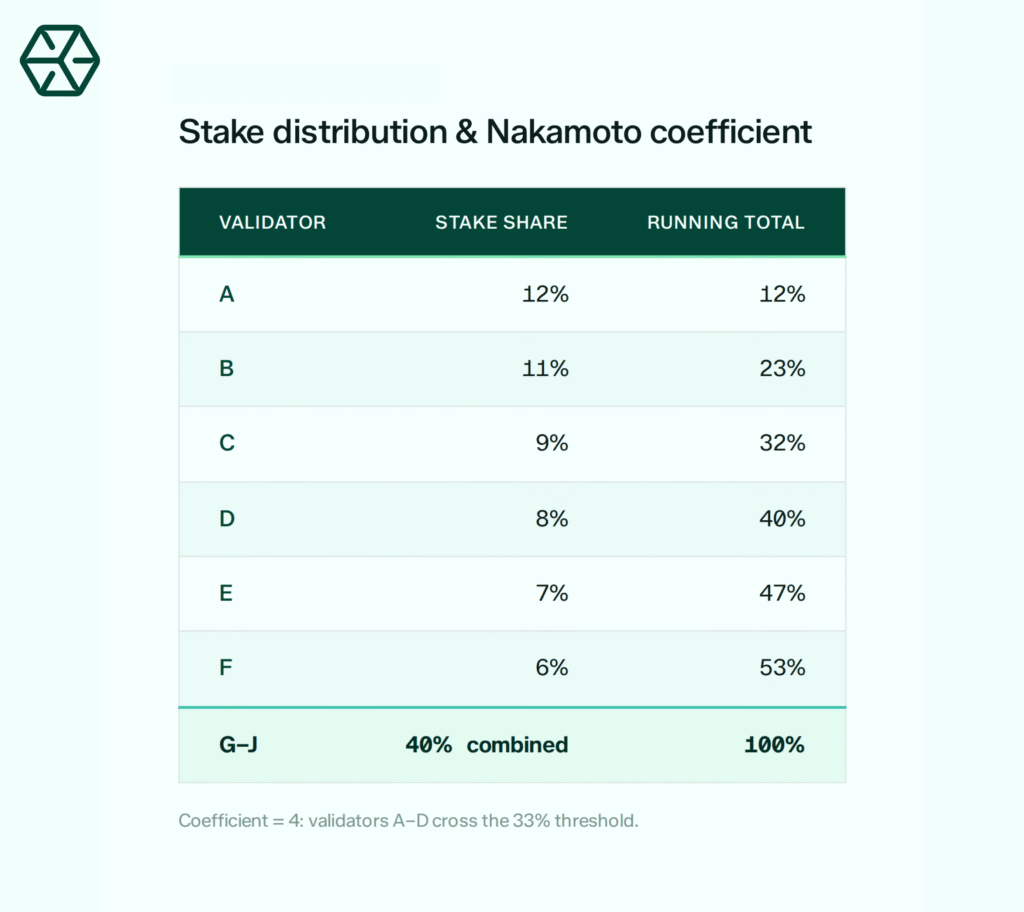
Here, A, B and C together hold 32%, short of the threshold. Adding D pushes the total to 40%, so the coefficient is 4.
That means 4 entities, acting together, could halt this network. The remaining 6 validators are irrelevant to the calculation, no matter how many there are.
The same method produces a separate figure for each subsystem. If 3 hosting providers together serve 33% of stake, the hosting coefficient is 3.
If 2 client implementations cover more than two-thirds of nodes, a single client bug threatens the chain. Each of these numbers tells a different part of the decentralization story.
Why validator count is a misleading metric
Validator count is the number that says the least about validator concentration.
A chain can list thousands of validators while a handful control the stake that decides consensus. Counting nodes treats a validator holding 0.01% of stake the same as one holding 8%.
The superminority is the set of validators that together hold more than 33% of stake. The size of the superminority makes the consensus coefficient. On a decentralized network it grows; on a concentrated one it decreases even if the validator list expands.
Validator diversity is a question of how stake distributes across operators. Technically, a network with hundreds of small validators has not improved its coefficient if the new stake keeps routing to the largest operators.
This is why staking centralization could increase with the validator count going up.
Four axes of validator diversity
The proof of stake security model depends on four separate axes, and a network can score well on one while scoring badly on another. A single consensus number hides which axis carries the risk.
Stake distribution
Stake distribution measures how evenly stake, and therefore voting power, spreads across independent operators. It is the source of the headline coefficient.
Concentrated stake means a small superminority and a low coefficient.
Validator client diversity
Validator client diversity measures how many independent software implementations run the network. If one client powers more than two-thirds of validators, a single bug in that client can stop finality or trigger a mass slashing event.
Client monoculture is a correlated risk that stake distribution alone cannot show. The rollout of new clients such as Frankendancer and Firedancer on Solana is a direct response to this concern, detailed in our explainer on Solana validator clients.
Hosting and cloud concentration
Validators need servers, and a large share rent them from the same handful of cloud providers. If 33% of stake runs inside one data center or one cloud region, an outage or a policy decision at that provider can halt the network regardless of how many separate operators are involved.
Correlated hosting has caused real disruptions, as covered in our piece on Solana validator concentration after the Teraswitch halt.
Jurisdictional concentration
Validators sit in physical countries under specific legal regimes. If a large share of stake operates within a few jurisdictions, one regulatory action or legal order can compel correlated behavior.
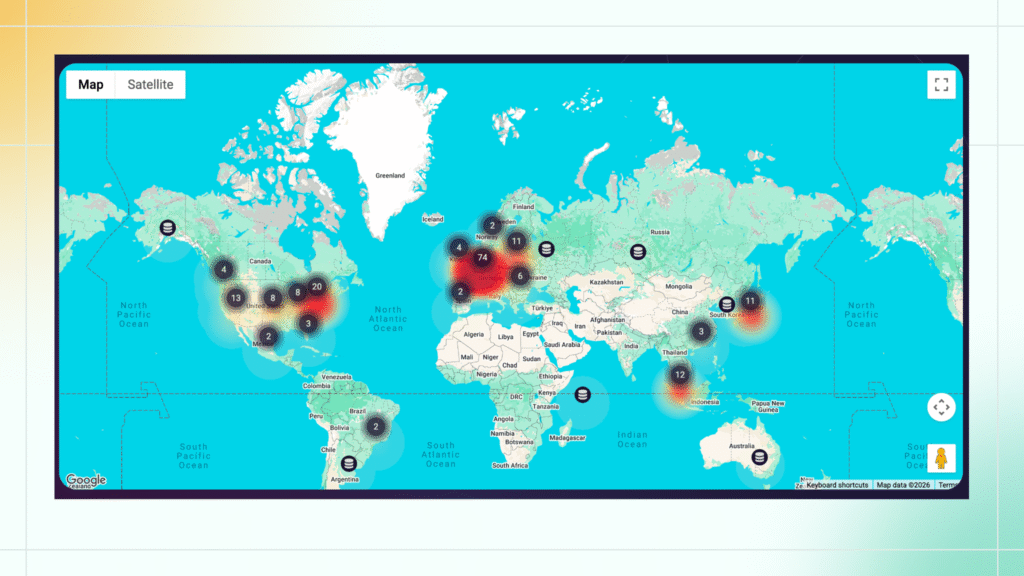
Recent measurements of Solana found 4 jurisdictions each holding more than 10% of stake, with the US the largest at 18.3%. Geographic spread reduces this correlated legal risk.
Where institutional validators help and where they concentrate
Institutional validators are a real improvement on some axes and a source of concentration on others. On the reliability side, institutional operators bring disciplined operations, redundant infrastructure, 24/7 monitoring and audited controls. This reduces the chance of downtime and slashing, which strengthens the network’s day-to-day liveness. The benefits include:
- Higher uptime and fewer missed attestations.
- Formal security practices and independent audits.
- Professional node key management that lowers the chance of a catastrophic error.
- Active participation in governance and protocol upgrades.
On the concentration side, institutions tend to cluster:
- Correlated hosting, since large operators favor a few enterprise-grade providers.
- Jurisdictional overlap, since regulated firms concentrate in a handful of compliant regions.
- Stake concentration, when delegators route large balances to a small set of trusted names.
The net effect depends on which operators receive the stake. Stake routing to an independent operator that runs its own multi-region, multi-provider infrastructure moves the coefficient up.
Stake routing to an operator that is inside a crowded jurisdiction or a shared data center moves it down.
Network comparison: Ethereum vs Solana vs Aptos
The table below shows consensus-layer Nakamoto coefficients for three networks, alongside validator counts. It uses a snapshot dated September 22, 2026, drawing on Chainspect for on-chain figures and entity-level trackers for the staking-provider view.
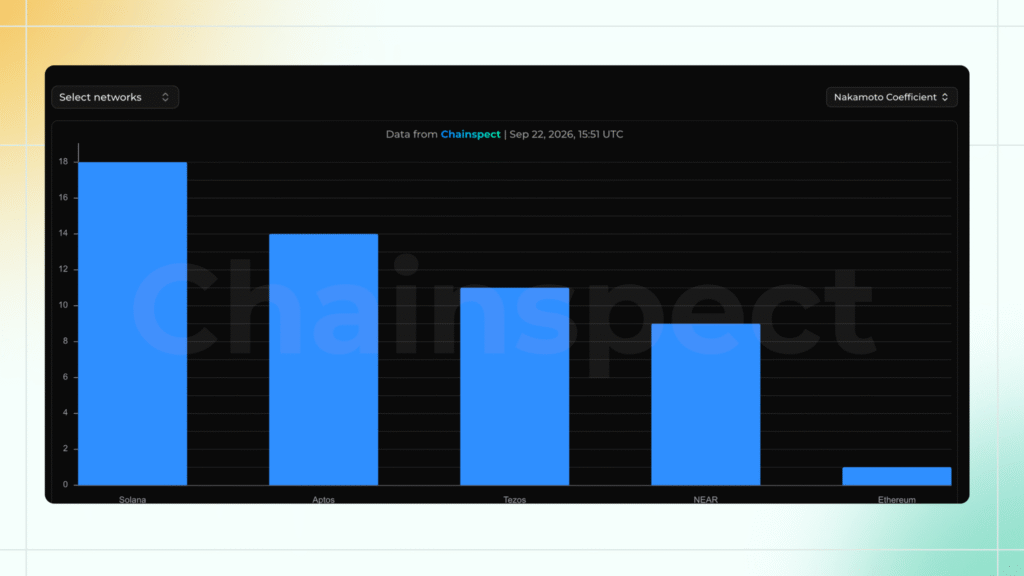
Figures move daily, so treat them as a point-in-time reading.
| Network | Validator count | Nakamoto coefficient | Notes on measurement |
| Ethereum | ~1,361,000 | 1–5 | Node-level count reads 1 because one liquid-staking provider nears the threshold; entity-level trackers put it at 2–5 depending on date and method. |
| Solana | ~677 active | 18 | Down from a 2023 peak near 34; top operators hold a growing share of stake. |
| Aptos | ~85 | 14 | Smaller validator set, but stake spreads relatively evenly across it. |
Ethereum has by far the most validators and one of the lowest effective coefficients, because stake concentrates through a few staking providers.
Aptos has a fraction of Solana’s validators yet posts a comparable coefficient, because its stake is more evenly spread.
Networks like Canton are a separate case for institutional readers. It uses an invitation-only set of 60 super validators, each holding one equal vote in BFT consensus, including names such as Visa, DTCC, Nasdaq and Circle.
That design trades open participation for vetted, equal-weight governance. It is a different security model that a stake-weighted coefficient could not capture.
What delegators can do about it
The coefficient is the sum of where the stake goes, delegators might consider the following options:
- Choose independent operators. Stake routed to an operator outside the current superminority raises the coefficient, while stake added to the largest names lowers it.
- Weigh hosting and jurisdiction. An operator running its own multi-region, multi-provider infrastructure reduces correlated risk more than one concentrated in a single cloud or country.
- Favor client diversity. Where a network offers more than one validator client, supporting a minority client reduces monoculture risk.
Distributed validator technology can further divide trust across machines, as covered in our DVT overview.
Everstake has historically operated validators on 130+ networks as an independent operator, with infrastructure distributed across multiple regions and hosting providers. Its controls are covered by a SOC 2 Type II report and ISO 27001 certification, and it has completed an independent assessment against DORA controls.
For teams evaluating operators on the four axes above, independence and infrastructure spread bear directly on the stake, hosting and jurisdictional coefficients, while the security attestations speak to operational reliability.
FAQ
What is the Nakamoto coefficient?
The Nakamoto coefficient is the smallest number of independent entities that would have to collude to control or halt a blockchain subsystem, most often the consensus layer. A higher number indicates stronger decentralization.
How is the Nakamoto coefficient calculated?
Rank all participants by their share of the controlling resource, then add shares from largest to smallest until the total crosses the attack threshold. For proof-of-stake that threshold is 33% of stake.
How do you measure blockchain decentralization?
You measure it across four axes: stake distribution, client diversity, hosting and cloud concentration, and jurisdictional spread. Each produces its own coefficient, and the lowest one is the binding constraint.
What is the Nakamoto coefficient for Ethereum?
Node-level trackers can read as low as 1 because one staking provider nears the threshold, while entity-level trackers place Ethereum around 2 to 5 depending on the snapshot date and method. The figure moves as staking-provider shares change.
What is the Nakamoto coefficient for Solana?
As of the September 22, 2026 snapshot, Solana sat near 18 on Chainspect. That is down from a peak close to 34 in 2023.
Why is validator count a misleading metric?
Validator count treats every validator as equal regardless of stake. A network can list thousands of validators while a handful hold enough stake to form the superminority and decide consensus.
What is the superminority?
The superminority is the set of validators that together control more than 33% of stake. Its size equals the consensus Nakamoto coefficient.
Does a higher validator count mean better decentralization?
A higher validator count alone does not improve decentralization. It improves only when new stake spreads across independent operators, clients, hosts and jurisdictions.
Share with your network